Lighthouse is an amazing tool that you can use to quickly audit a web page and learn how it stacks up on performance, accessibility, best practices, PWA support and more. You can run it from ChromeDevTools, run one via WebPageTest measurement or analyze them in bulk here! For every page measured in the HTTP Archive a lighthouse audit is run, and the results are stored in the lighthouse tables.

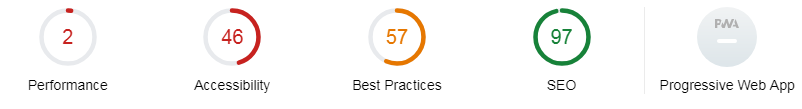
Recently while analyzing a poor performing website, I wondered how many sites in the HTTP Archive perform so poorly that they would get a single digit Performance score!
Fortunately, the results are fairly easy to query for. Since the Lighthouse report is stored as a JSON array, it’s just a matter of extracting the JSON variables using the JSON_EXTRACT function.:
JSON_EXTRACT(report, '$.categories.performance.score')
If we want to analyze the scores, then we will have to CAST the output from the above example as numeric.
CAST(JSON_EXTRACT(report, '$.categories.performance.score') as NUMERIC)
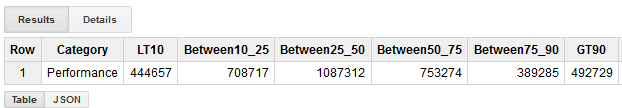
I thought it would be interesting to look at some of the ranges of scores for the Performance category across the 4 million websites tracked in the HTTP Archive. How many scored good on performance, SEO, etc? And how many score poorly? Here’s a query that will summarize all of the performance scores (Note: this will process 895GB, which would consume most of the free monthly quota):
SELECT "Performance" as Category,
       COUNTIF(score<.10) LT10,
       COUNTIF(score >=.1 and score < .25) Between10_25,
       COUNTIF(score >=.25 and score < .50) Between25_50,
       COUNTIF(score >=.50 and score < .75) Between50_75,
       COUNTIF(score >=.75 and score < .9) Between75_90,
       COUNTIF(score >=.9) GT90
FROM (
       SELECT CAST(JSON_EXTRACT(report, '$.categories.performance.score') as NUMERIC) AS score
       FROM `httparchive.latest.lighthouse_mobile`
)
There are 444,657 websites that have a Performance score less than 10%!
We can also UNION a bunch of queries together to add some of the other categories to the results. The following query also uses 895GB.
SELECT "Performance" as Category,
       COUNTIF(score<.10) LT10,
       COUNTIF(score >=.1 and score < .25) Between10_25,
       COUNTIF(score >=.25 and score < .50) Between25_50,
       COUNTIF(score >=.50 and score < .75) Between50_75,
       COUNTIF(score >=.75 and score < .9) Between75_90,
       COUNTIF(score >=.9) GT90

FROM (
    SELECT CAST(JSON_EXTRACT(report, '$.categories.performance.score') as NUMERIC) AS score
    FROM `httparchive.latest.lighthouse_mobile`
)
UNION ALL
SELECT "Accessibiity" as Category,
       COUNTIF(score<.10) LT10,
       COUNTIF(score >=.1 and score < .25) Between10_25,
       COUNTIF(score >=.25 and score < .50) Between25_50,
       COUNTIF(score >=.50 and score < .75) Between50_75,
       COUNTIF(score >=.75 and score < .9) Between75_90,
       COUNTIF(score >=.9) GT90
FROM (
    SELECT CAST(JSON_EXTRACT(report, '$.categories.accessibility.score') as NUMERIC) AS score
    FROM `httparchive.latest.lighthouse_mobile`
)
UNION ALL
SELECT "Best Practices" as Category,
       COUNTIF(score<.10) LT10,
       COUNTIF(score >=.1 and score < .25) Between10_25,
       COUNTIF(score >=.25 and score < .50) Between25_50,
       COUNTIF(score >=.50 and score < .75) Between50_75,
       COUNTIF(score >=.75 and score < .9) Between75_90,
       COUNTIF(score >=.9) GT90
FROM (
    SELECT CAST(JSON_EXTRACT(report, '$.categories.best-practices.score') as NUMERIC) AS score
    FROM `httparchive.latest.lighthouse_mobile`
)
UNION ALL
SELECT "SEO" as Category,
       COUNTIF(score<.10) LT10,
       COUNTIF(score >=.1 and score < .25) Between10_25,
       COUNTIF(score >=.25 and score < .50) Between25_50,
       COUNTIF(score >=.50 and score < .75) Between50_75,
       COUNTIF(score >=.75 and score < .9) Between75_90,
       COUNTIF(score >=.9) GT90
FROM (
    SELECT CAST(JSON_EXTRACT(report, '$.categories.seo.score') as NUMERIC) AS score
    FROM `httparchive.latest.lighthouse_mobile`
)
UNION ALL
SELECT "PWA" as Category,
       COUNTIF(score<.10) LT10,
       COUNTIF(score >=.1 and score < .25) Between10_25,
       COUNTIF(score >=.25 and score < .50) Between25_50,
       COUNTIF(score >=.50 and score < .75) Between50_75,
       COUNTIF(score >=.75 and score < .9) Between75_90,
       COUNTIF(score >=.9) GT90
FROM (
    SELECT CAST(JSON_EXTRACT(report, '$.categories.pwa.score') as NUMERIC) AS score
    FROM `httparchive.latest.lighthouse_mobile`
)
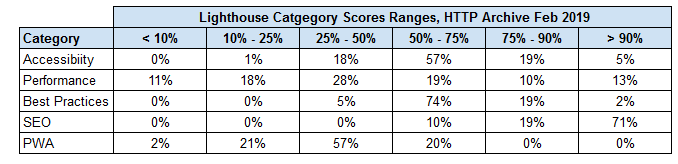
The results count the number of sites that have lighthouse scores < 10%, 10-25%, 25-50%, 50-75% and > 90%.
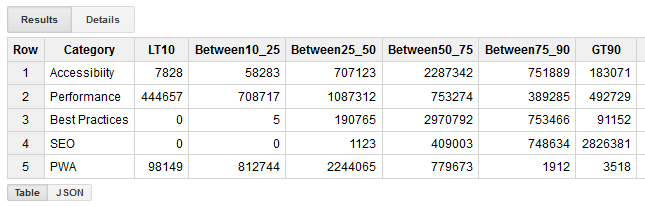
If we look at these in terms of %s of total, we can see that the performance scores follow a normal distribution, with almost as many poorly performing sites as there are sites with excellent performance scores. The majority of sites pass the SEO audits. PWA support is relatively low across the web with only 3518 sites achieving a >90% score. But we can track their adoption report and see that the scores are increasing each month!
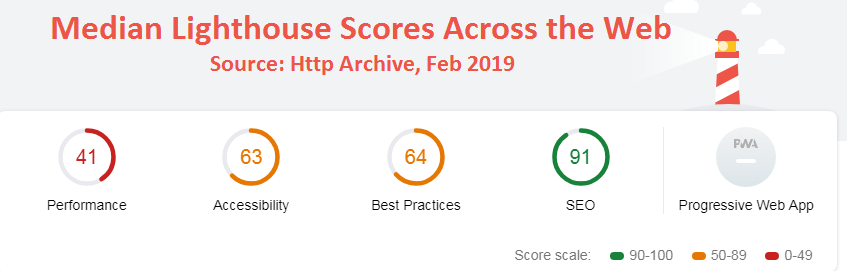
How about giving the web a Lighthouse summary score? We can use the following query to calculate the median score across all 4 million websites (note: 895GB query)
SELECT APPROX_QUANTILES(CAST(JSON_EXTRACT(report, '$.categories.performance.score') as NUMERIC), 100)[SAFE_ORDINAL(50)] AS Performance,
	   APPROX_QUANTILES(CAST(JSON_EXTRACT(report, '$.categories.accessibility.score') as NUMERIC), 100)[SAFE_ORDINAL(50)] AS Accessibility,
	   APPROX_QUANTILES(CAST(JSON_EXTRACT(report, '$.categories.best-practices.score') as NUMERIC), 100)[SAFE_ORDINAL(50)] AS BestPractices,
	   APPROX_QUANTILES(CAST(JSON_EXTRACT(report, '$.categories.seo.score') as NUMERIC), 100)[SAFE_ORDINAL(50)] AS SEO,
	   APPROX_QUANTILES(CAST(JSON_EXTRACT(report, '$.categories.pwa.score') as NUMERIC), 100)[SAFE_ORDINAL(50)] AS PWA
FROM `httparchive.latest.lighthouse_mobile`
Clearly we have much work to do on Performance, Accessibility and Best Practices!