
Images are a central part of the web. Beautiful imagery draws customers deeper into the story that your webpage is attempting to tell – whether it is news, entertainment, or e-commerce. And as important as images are – the (potentially) large size of images can hurt the load time of the same pages, leading to customer abandonment. In fact, the HTTP Archive shows that the average mobile website is ~50% images (in KB):

This percentage has held relatively constant for a number of years, but at the same time, webpages are growing larger, meaning that images are also growing larger. In fact, year over year, we see that images on mobile have increased in size by 8%, while the number of images on the page has actually decreased by 2.6%:


This implies that images on mobile webpages are getting larger over time.
What can be done to decrease image size?
There are many image optimization strategies to help streamline delivery of images in a way that does not affect the quality of the image on the page (for a detailed review, Addy Osmani’s Essential Image Optimization Guide is an excellent reference https://images.guide/). In this post, I will focus on 4 optimization strategies: Lazy Loading (LL), Image Optimization (IO), Responsive Images (RI) and Image Format (IF). It may come as no surprise that these four best practices are included in Chrome Lighthouse website audits, and these audits are available in the HTTP Archive – allowing us to gain detailed insights into these optimizations.
Lighthouse Definitions
When looking at data, it is important to understand what the data is actually telling us. The tests are looking at:
Lazy Loading (LL): Lighthouse identifies images that are off screen. If these images are loaded before time to interactive, the test fails. The test passes if images off screen are requested before the page is interactive. By deferring load of images that do not appear immediately, the page will be interactive faster.
Image Optimization (IO): Tests all JPEG (and only JPEG) images on the page to see if they are at quality 85% (or lower). If images are served at 85%, the test passes. Google recommends a quality setting 85% as a good balance image quality vs. image size.
Responsive Images (RI): Lighthouse calculates the size of the rendered image and compares it to the downloaded image. If the image on the screen is over 25KB smaller than the image downloaded, the audit fails. The goal here is to offer appropriately dimensioned images to the device requesting the files (no desktop retina sized images on a small smartphone).
Image Format (IF): Lighthouse checks to see if a next gen format (JPEG2000, WebP) will save over 8 KB on any given image. Since all mobile HTTP Archive tests are all run on emulated Chrome – the format of choice will be WebP.
Data Collection
The HTTP Archive collects a WebPageTest trace of the top 500,000 sites every two weeks, including Lighthouse data (on mobile runs). Using BigQuery, we can query this information, and begin our analysis:
SELECT
    url,
    integer(JSON_EXTRACT(report, "$.audits.offscreen-images.score")) offscreenScore,
    integer(JSON_EXTRACT(report, "$.audits.offscreen-images.extendedInfo.value.wastedMs")) wastedms,
    integer(JSON_EXTRACT(report, "$.audits.offscreen-images.extendedInfo.value.wastedKb")) wastedkb,
    JSON_EXTRACT(report, "$.audits.offscreen-images.extendedInfo.value.results") wastedresults,

    integer(JSON_EXTRACT(report, "$.audits.uses-optimized-images.score")) optimagesScore,
    integer(JSON_EXTRACT(report, "$.audits.uses-optimized-images.extendedInfo.value.wastedMs")) optimgwastedms,
    integer(JSON_EXTRACT(report, "$.audits.uses-optimized-images.extendedInfo.value.wastedKb")) optimgwastedkb,
    JSON_EXTRACT(report, "$.audits.uses-optimized-images.extendedInfo.value.results") optimgwastedresults,

    integer(JSON_EXTRACT(report, "$.audits.uses-responsive-images.score")) repimagesScore,
    integer(JSON_EXTRACT(report, "$.audits.uses-responsive-images.extendedInfo.value.wastedMs")) respimgwastedms,
    integer(JSON_EXTRACT(report, "$.audits.uses-responsive-images.extendedInfo.value.wastedKb")) respimgwastedkb,
    JSON_EXTRACT(report, "$.audits.uses-responsive-images.extendedInfo.value.results") respimgwastedresults,

    integer(JSON_EXTRACT(report, "$.audits.uses-webp-images.score")) webpimagesScore,
    integer(JSON_EXTRACT(report, "$.audits.uses-webp-images.extendedInfo.value.wastedMs")) webpimgwastedms,
    integer(JSON_EXTRACT(report, "$.audits.uses-webp-images.extendedInfo.value.wastedKb")) webpimgwastedkb,
    JSON_EXTRACT(report, "$.audits.uses-webp-images.extendedInfo.value.results") webpimgwastedresults,


  FROM
    [httparchive:lighthouse.2018_03_15_mobile]
Let’s unwrap what these lines are saying:
integer(JSON_EXTRACT(report, “$.audits.offscreen-images.score”)) offscreenScore
Since the data is JSON in the column ‘report’, the results are all strings. Since we want to work with the results as numbers, I wrap the integer() parameter to convert them to values. JSON_EXTRACT takes the report (the Lighthouse JSON) and extracts the child ‘audits → offscreen-images → score’ attribute.
NOTE: this query takes 131 GB to run (of your monthly 1TB of free queries). Paul Calvano https://bigquery.cloud.google.com/dataset/api-project-658924507062:httparchive_sampleset has created some sample queries that are a lot smaller for optimizing your queries before running on the large datasets. Once you have optimized your query – save it in a table – so you can refine and run more queries – without breaking your BigQuery ‘bank.’ My table was 5.8 GB – a much smaller sample size to run queries on.
Image Optimizations
The four optimizations are all scored, and the possible scores are 0 (poor), 65 (average), 90 and 100 (good). We can identify the scores for each of the audits:
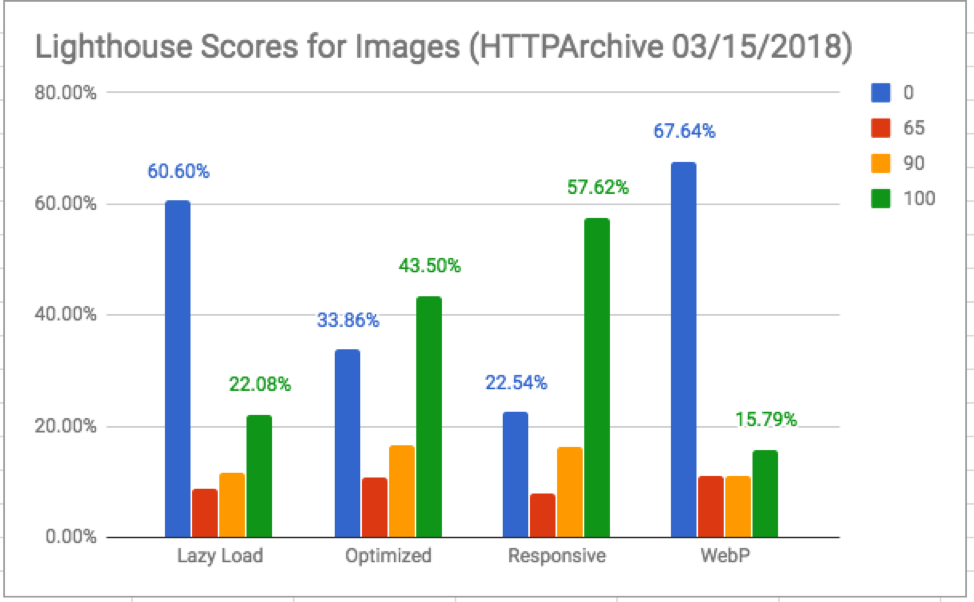
Interestingly, for all of the audits, over 75% of websites either score 0 or 100. It is also clear that Optimized Images (43% score 100) and Responsive Images (57% score 100) are implemented much more frequently than Lazy Loading (22%) or Image Format (16%).
70% of sites (310k) have at least one image optimization score of 100. This (sadly) means that 30% (130k) of sites have no scores of 100.
What Is the Cost of a Failure?
The Lighthouse report estimates the cost of each failure with 2 metrics: the cost in KB (excess data sent over the network) and milliseconds (the cost spent loading the resource compared to the optimized version). Looking only at sites that score 0 (failure) for each audit we can find the median improvement score:
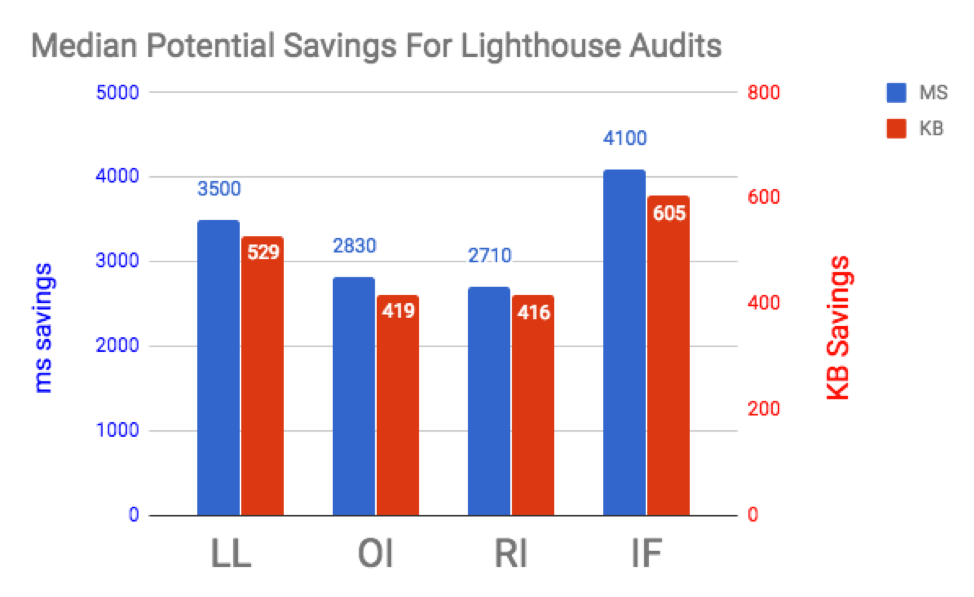
These are really impressive improvements! This chart is showing that the median improvement on a 3G network is between 2.7-4.1s. Of course, the improvement will be much larger on slower networks.
Optimization Distributions
Applying image optimizations to your site is additive, meaning that implementing more than one optimization will result in greater savings. We can identify how many sites have implemented multiple optimizations (and scored 100 on each optimization).
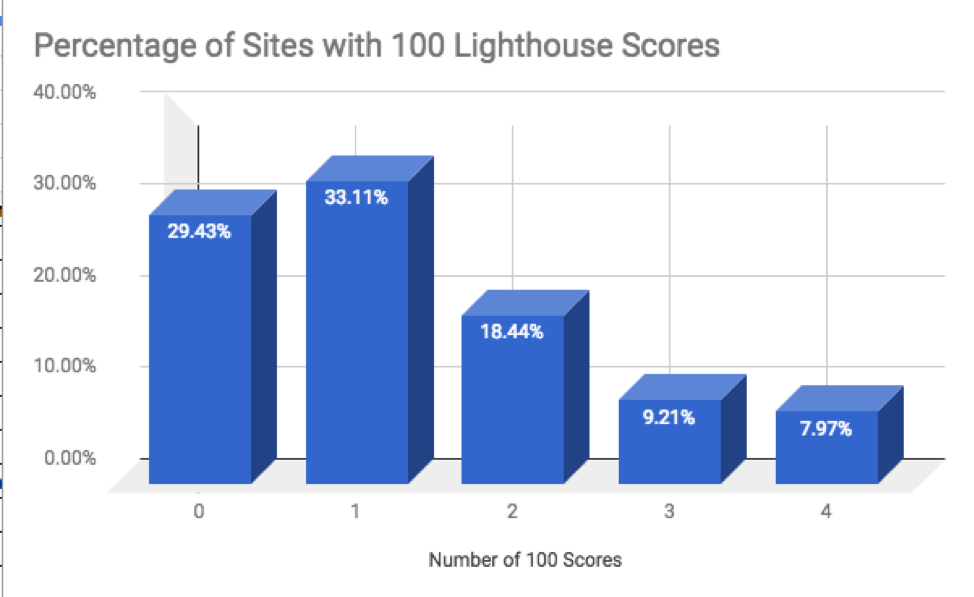
30% of the web pass zero of the four image tests. Over 70% of the web fail 2 or more tests (0, 1 or 2 scores of 100).
We can see the breakdown of these tests by type:
Percentages of 100 scores for Lighthouse audits:
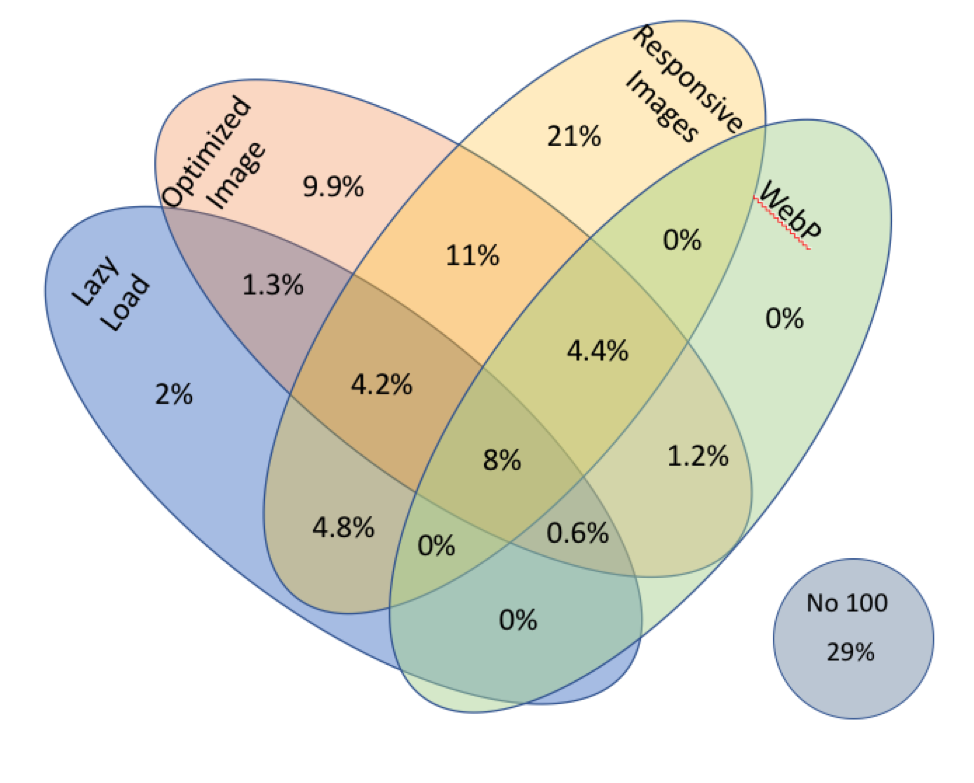
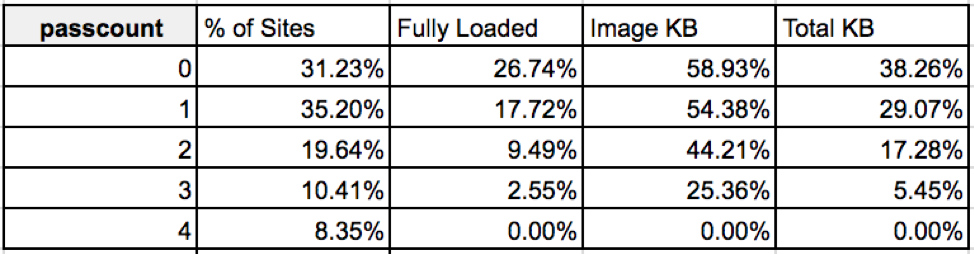
Of sites with optimizations, the most common intersections are Optimized Images and Responsive Images (with or without Lazy Load and WebP. Interestingly, the most populous section of this Venn Diagram is the 21% of sites that only pass the Responsive Images audit. Perhaps this is due a the push for “mobile first” websites?
The next most popular is Responsive and Optimized (11%), followed by Optimized Images (only). These three sections account for > 40% of the mobile web. The next most common implementation is all four audits passing at 8%.
This follows the chart at the top of this post, showing that Responsive and Optimized are the most common, and Lazy Load and Image Format are not as highly utilized. It also shows that Lazy Load and Image Format mostly appear as the 3rd or 4th optimization (in the sections with lots of overlap), indicating that they are additional optimizations made over time.
Sites With Multiple Optimizations
The data in HTTP Archive allows us to calculate the median savings potential based on the number of passed tests:
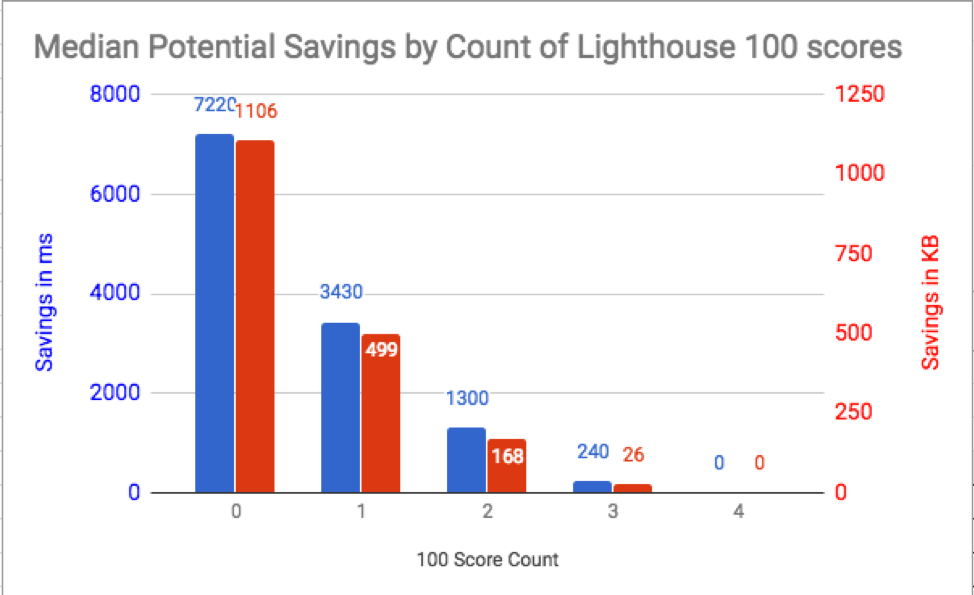
As expected, further optimizations improve load times, but each additional test provides slightly less benefit.
Combining the data in the above two sections:
31% of the web fail all four Lighthouse image audits. Resolving these failures has the potential to speed up these sites by 7 seconds (and 1.1 MB) through image optimization. Over 70% of the web fails 2 or more tests, indicating potential speedups of at least 1.3s (and savings of over 168KB).
Comparing to Actual Load Times
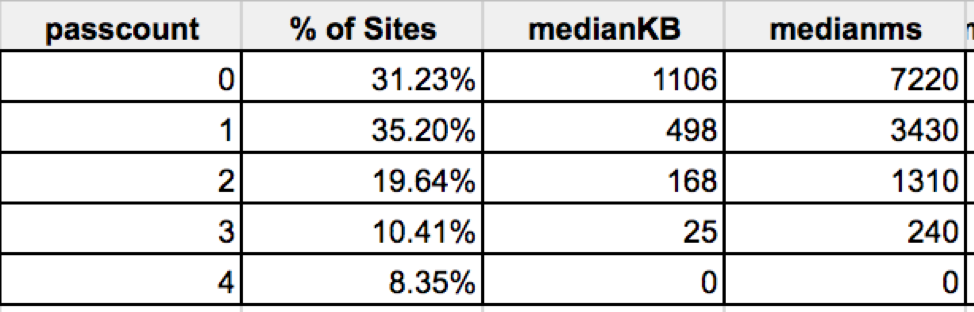
Since this data is all acquired from real page load tests, we can also obtain the actual load times for these sites. Subtracting the potential optimizations show that image optimization sites will gain huge speed increases for a significant cross section of the web.
This table gives us the percentage improvement for page load time and KB for sites that have passed different number of Lighthouse audits. For example, a site that fails all 4 audits (31.23% of sites) will see a median lift of 26% in load time, with a ~60% drop in image KB. Sites that have passed 3 audits (and have just one to fix) see a median 2.5% lift in load time, and a 25% drop in image KB.
We can also compare the load times of sites that pass all 4 audits (8% of the web) to sites that fail all four audits (10% of the web):
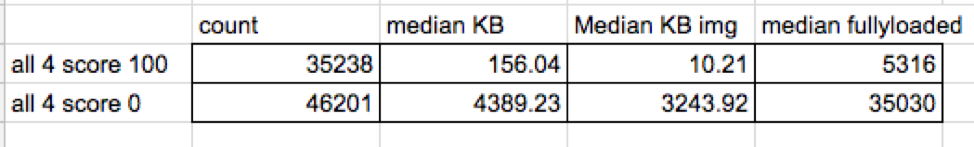
Now, this might not be a fair comparison, as we can see that sites that pass all four audits are pretty lightweight, while those that fail are huge (4.3 MB page on a mobile device!). However, the median site that pass the suggested optimizations loads 30 seconds(!?!) faster than the median site that fails all four audits.
Conclusion
Images make up a huge portion of the load time and tonnage on the mobile web. Lighthouse audits 4 image best practices, and only 8% pass all of them (and 10.4% fail all four!). The median savings for these optimizations range from 2.7-4.1 seconds and 400-600 KB of data. As more of the optimisations are added, sites get faster and use less data.
When every (milli)second counts, it is clear that image optimization is an underutilized, but highly effective way to improve the performance of your website.
To test your website with Lighthouse, use WebPageTest or Chrome DevTools, and find out where your site fits on this spectrum!
Thanks to Rick Viscomi for previewing. Crossposted at dougsillars.com
